Menu 03 - Financial Report Features
In this section all the applet features will be introduced accordingly.
3.1 General Access
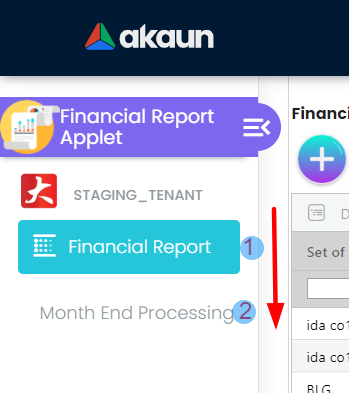
Users are able to open up the sidebar by clicking on the icon highlighted in the image below, this will allow the user to switch to different sections of the applet easily. There are three sections: Journal Transaction, Sub Ledger and Ledger.
3.2 Financial Report Feature
3.2.1 Journal Transaction Listing
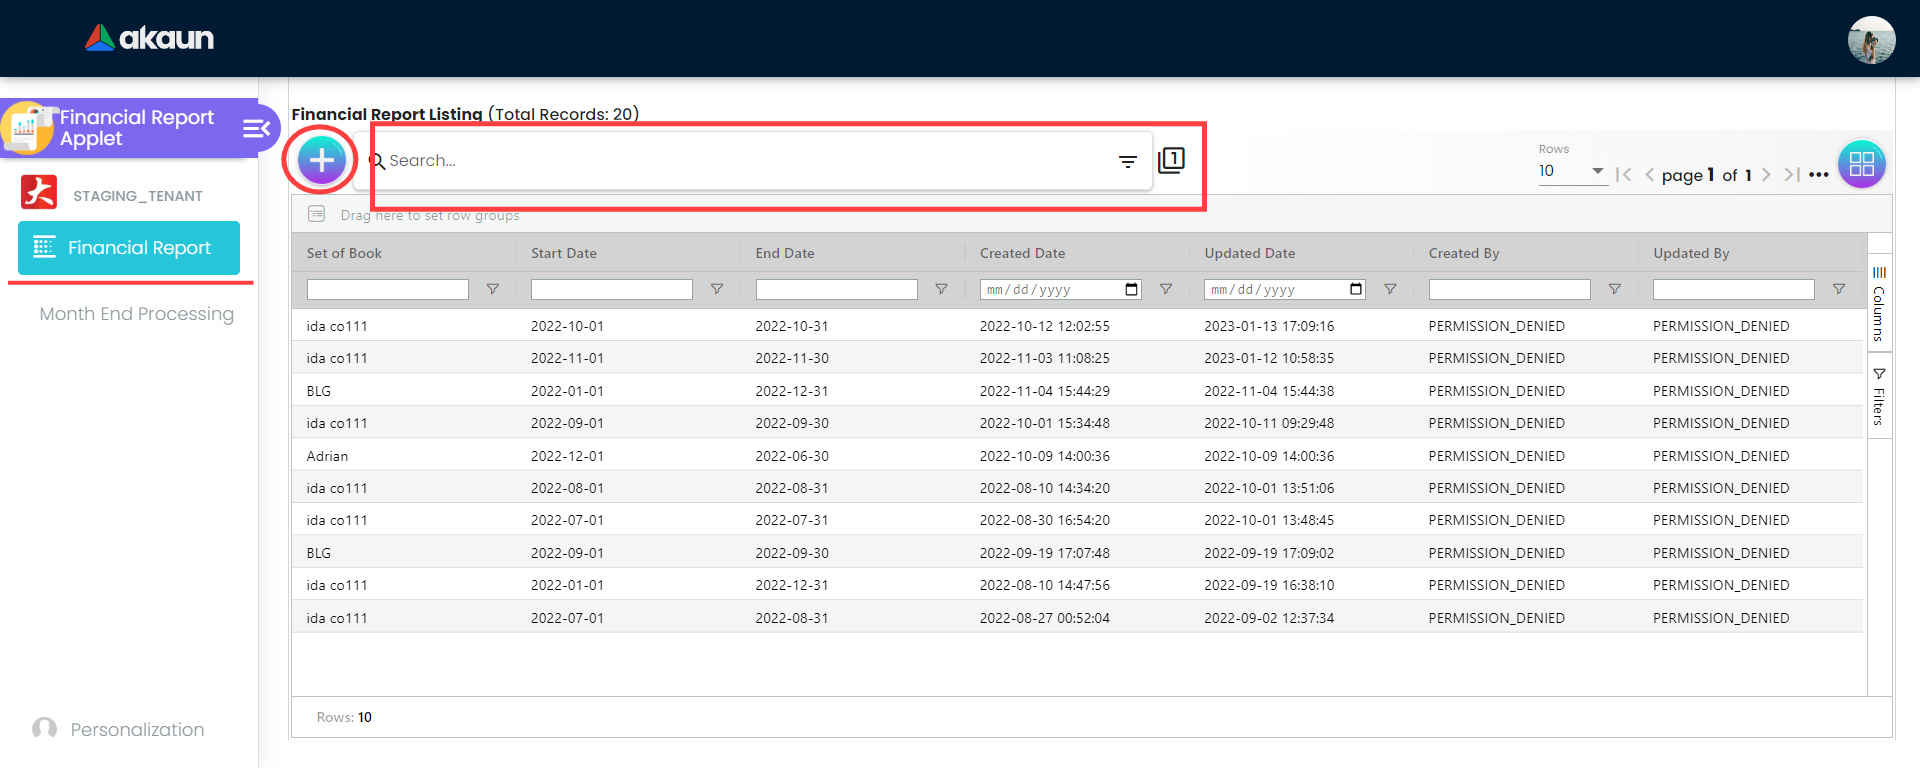
In this section which is the first page of the applet to display a list of financial reports in a table. In the financial report listing page there are plus “+” icon, search bar and table record. Plus icon functionality is to add a new financial report while search bar is to search for a particular financial report. Table records are financial reports when a user clicks on any record he/she is able to view all the financial report details. When a record clicked user will be directed into the clicked financial report details page. The table of the financial report is containing the following columns:
-
Set of Book
-
Start Date
-
End Date
-
Created Date
-
Updated Date
-
Created By
-
Updated By
3.2.2 Financial Report Create
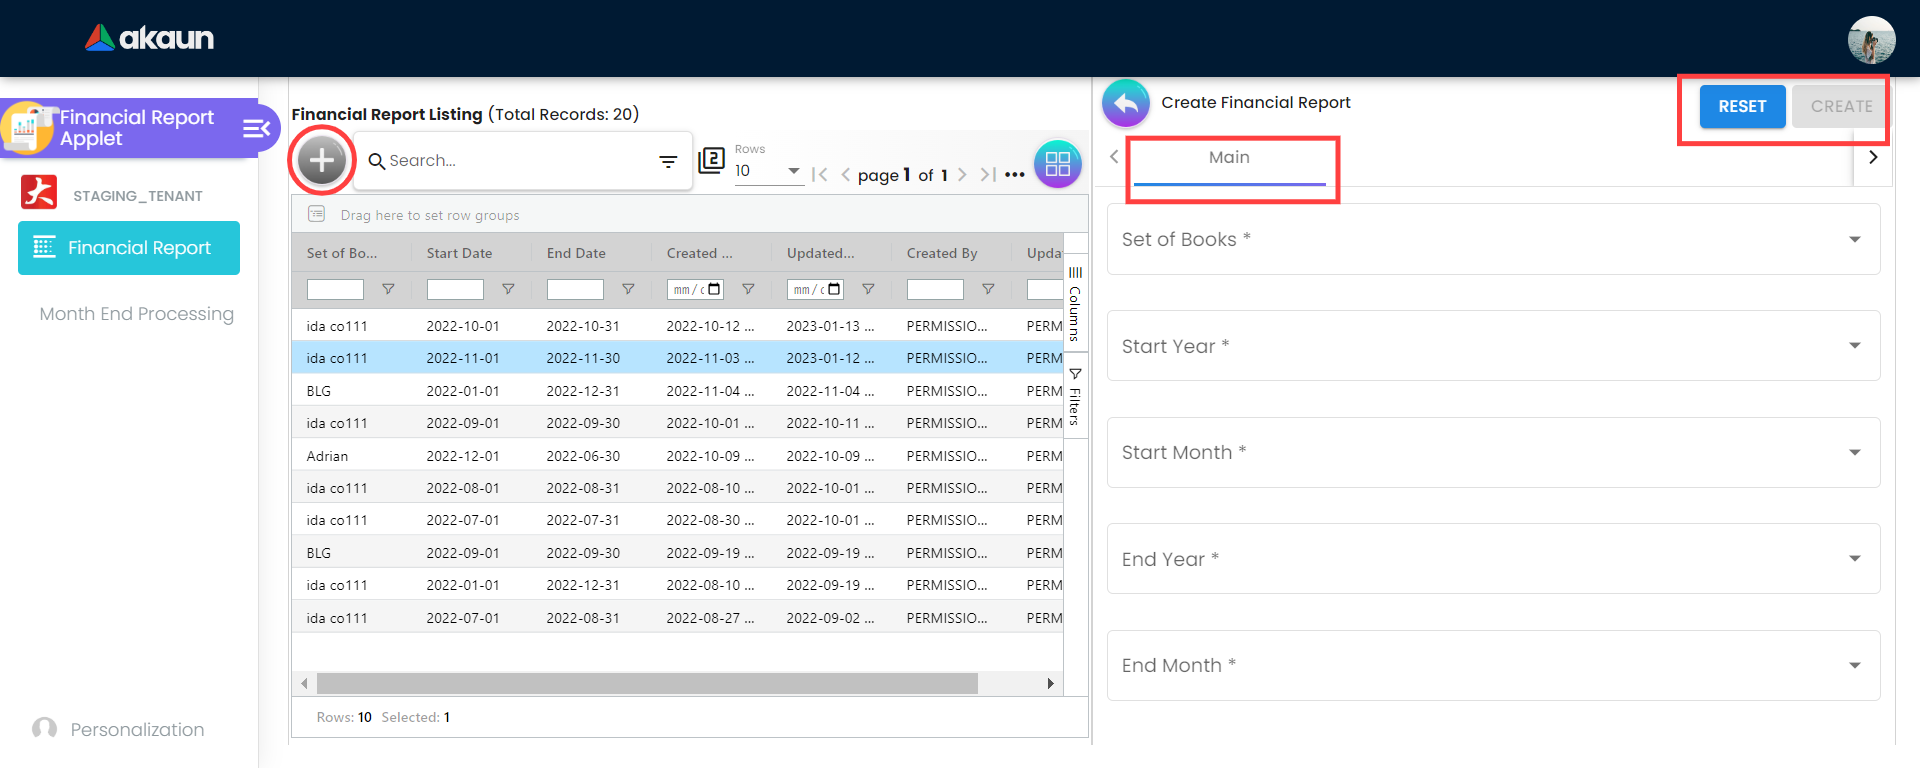
Financial report create page is the page to create a new financial report. At the top right side there is a plus icon to create a new financial report, users can click on the icon and the create page will popup. In the create page user is required to fill up all required data to create a financial report. Please be noted that if there is a “*” star sign on the text field, it is mandatory to fill in or select. In the create main tab these are the need data to be filled in to be able to create new financial report:
-
Set of Books
-
Start Year
-
Start Month
-
End Year
-
End Month
There are two buttons at the top left side: Rest button to clear data that has been inserted to the text box and create button to create the new financial report. Also there is a back icon to navigate users to the previous page.
3.2.3 Financial Report Listing Group By
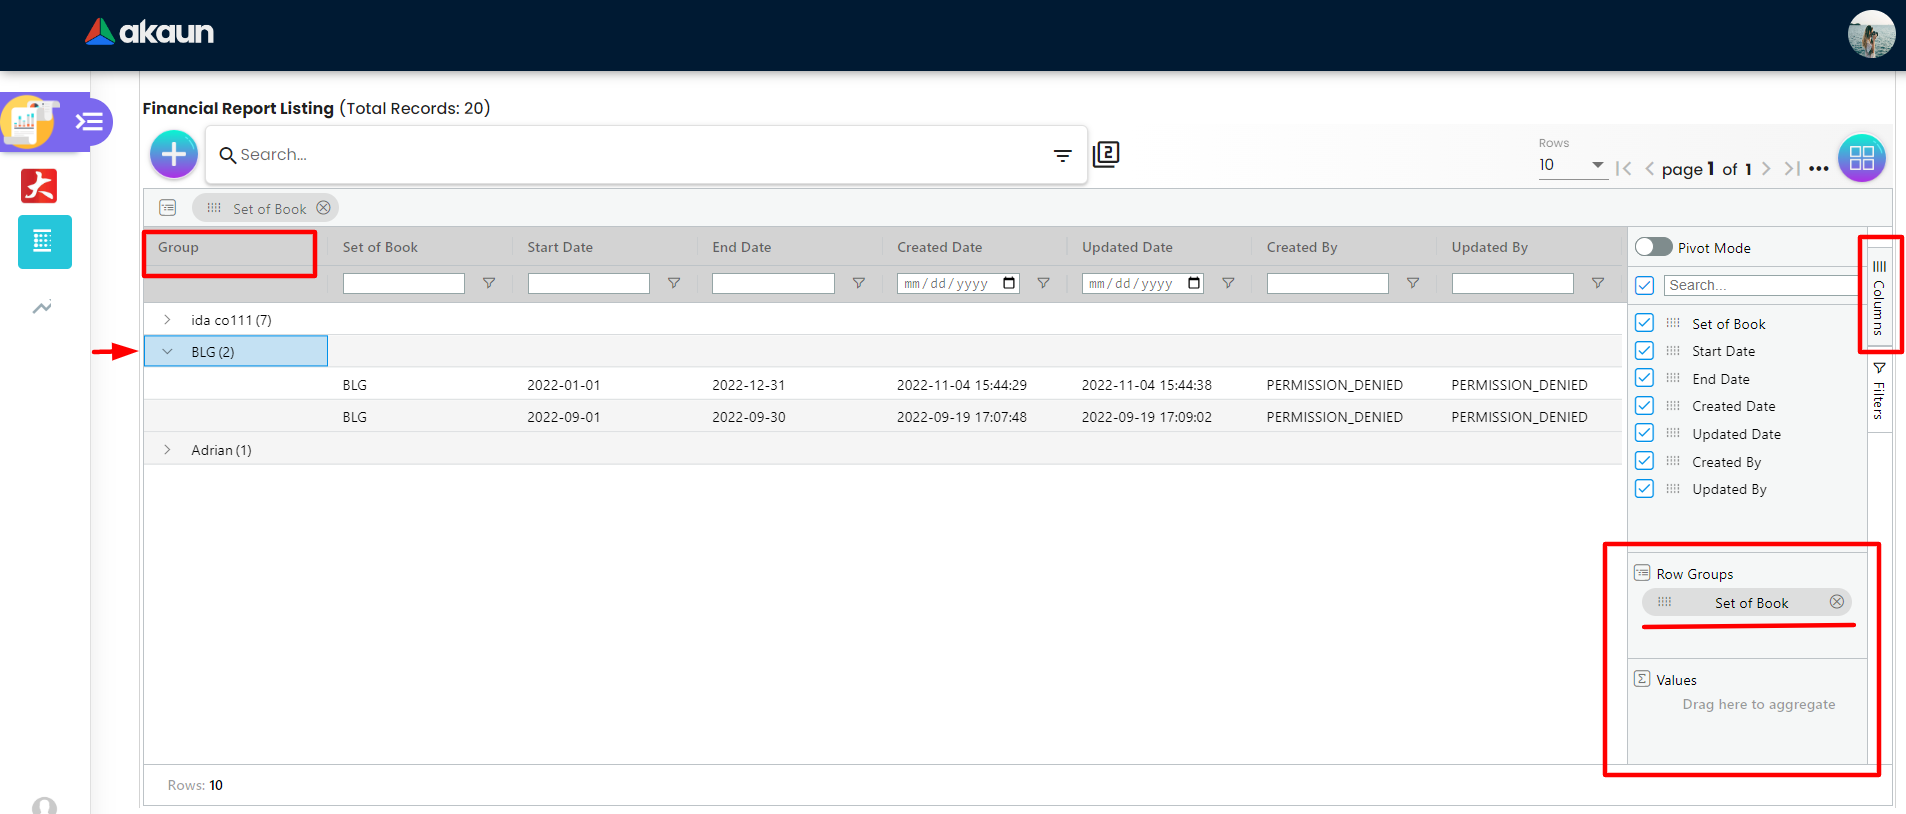
On the financial report listing page users can group data by column names. On the left side of the table there is a column menu list icon named columns. Users can click on it and the list will drop down the column names and on the bottom there is Row Group drag and drop area to allow users to drag a column name and drop it into the drag and drop area. The list of tables will be refreshed and display rows grouped by the selected column. In the shown example, the Set of the Book column is chosen to group rows based on it. So data on the table is refreshed and grouped by the set of books. Grouping can be a set of columns as well; just the user needs to drag and drop the extra columns he/she needs to group by. Pivot mode is a feature that allows you to rotate and reorganize the data in a pivot table to view it from different perspectives. It makes it easier to analyze and understand the data by summarizing it in a different way. To use pivot mode, you select the cells in the pivot table and use the feature to rearrange the rows and columns.
3.2.4 Financial Report Details Main Tab
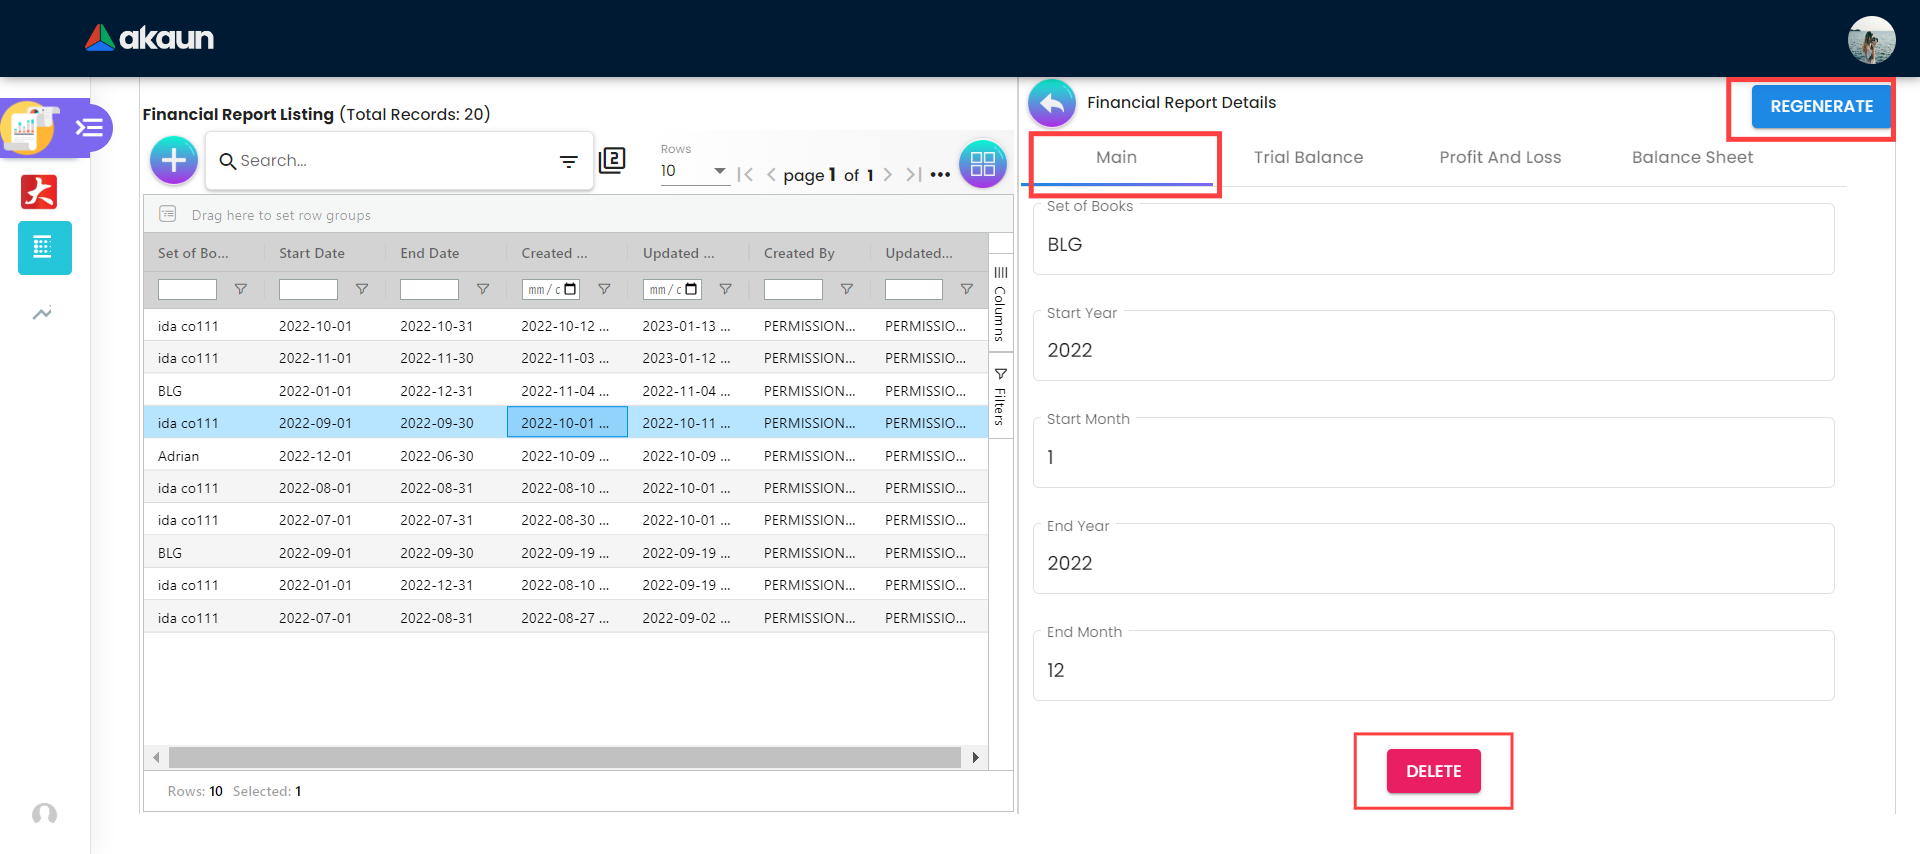
Users can view the financial report detail by clicking on any of the financial report rows on the financial report listing page. All the financial reports will be listed in a table as shown in the image above and each table row is clickable. Based on the financial report selected from the table the details page will display the details of the selected report. There are 4 tabs:
-
Main
-
Trial Balance
-
Profit And Loss
-
Balance Sheet
Here we are explaining the main tab, on the main tab there are five (5) main data of the financial report which are:
-
Set of Books
-
Start Year
-
Start Month
-
End Year
-
End Month
All these data are not editable but user is able to delete the main tab details by clicking on the delete button on the bottom of the page.
3.2.5 Profit And Loss Tab
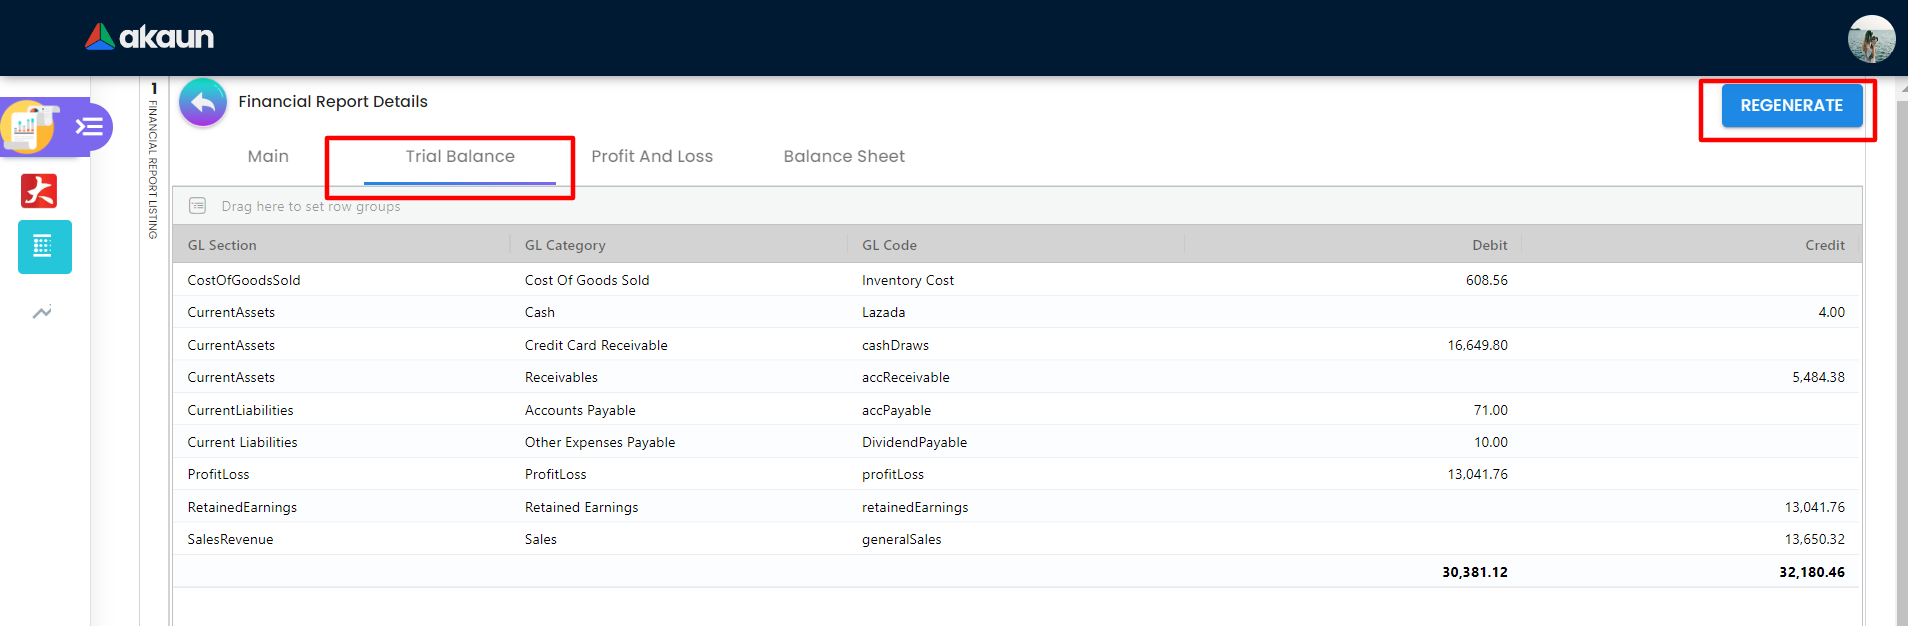
On trial balance tab a table will be list all the trial balance with the following data:
-
GL Section
-
GL Category
-
GL Code
-
Debit
-
Credit
Each row of the trial balance tab is clickable and when a user clicks on any row he/she will be directed into the GL section details page. Here is the GL sections:
-
Cost of Goods Sold
-
Current Assets - Cash
-
Current Assets - Credit Card Receivable
-
Current Assets - Receivable
-
Current Liabilities - Account Payable
-
Current Liabilities - Other Expenses Payable
-
Profit loss
-
Retained earnings
-
Sales Revenue
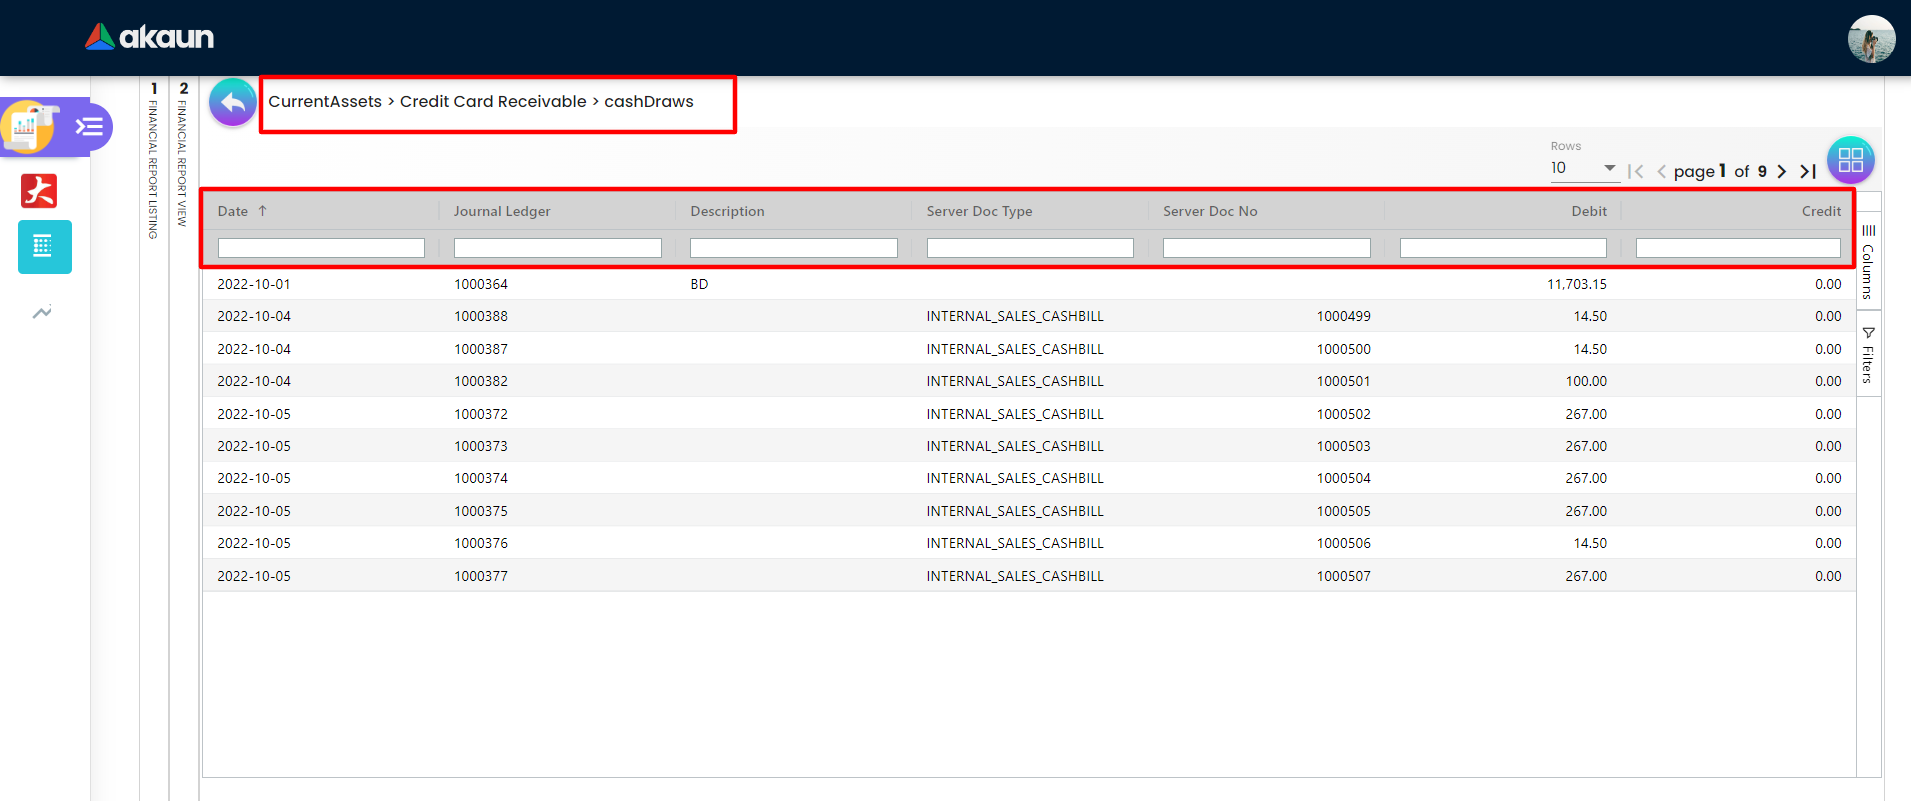
When a user clicks on any of these rows GL section / GL Category will be directed to the details page which will be shown on the image below with the following data:
-
Date
-
Journal Ledger
-
Description
-
Server Doc Type
-
Server Doc No
-
Debit
-
Credit
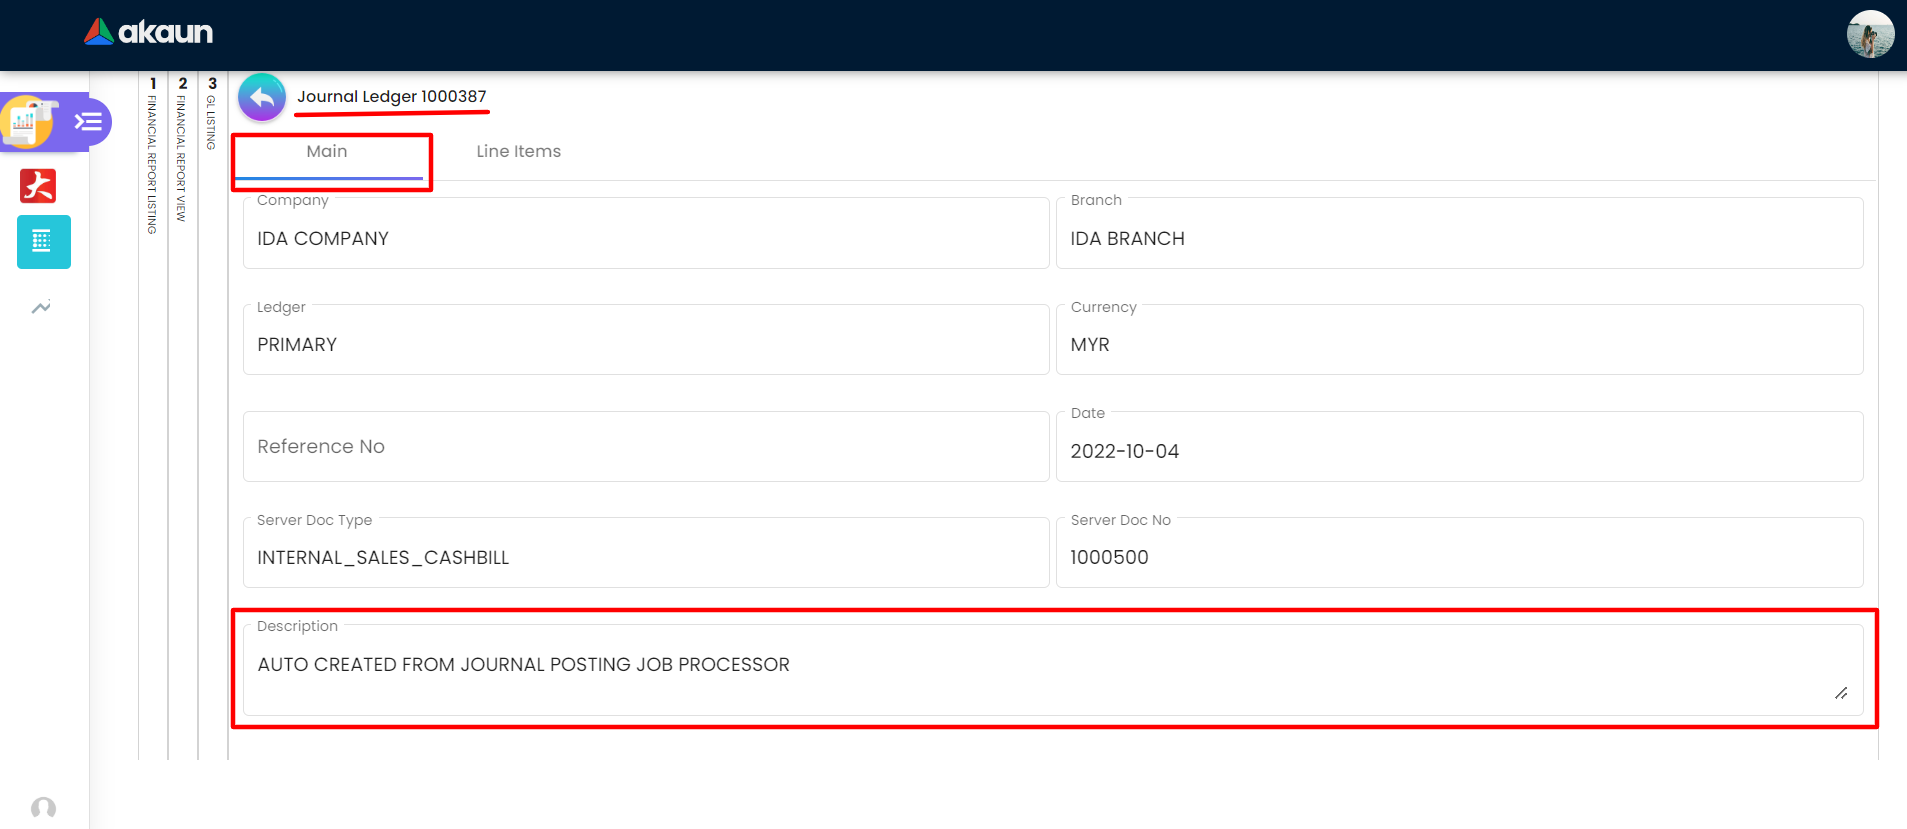
3.2.5.1 Trial Balance GLsection And GLCategory
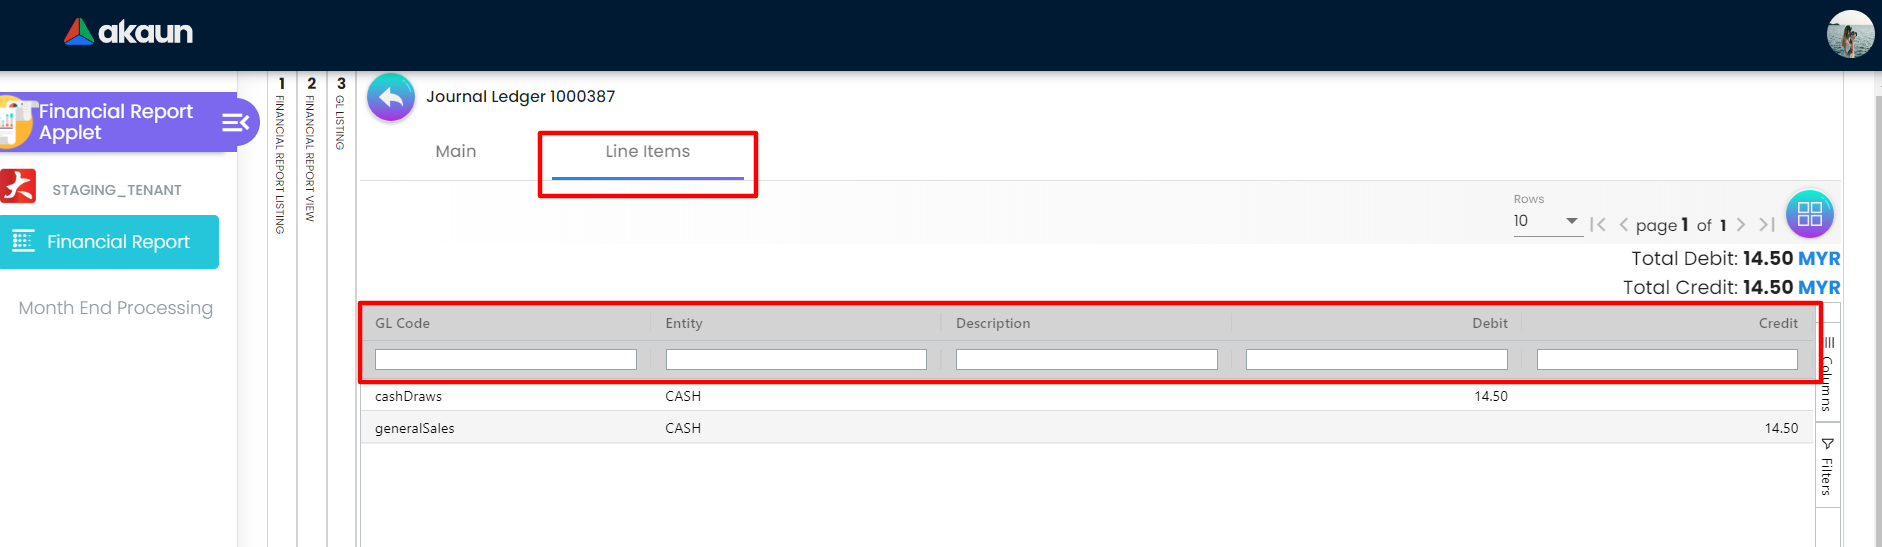
When a user clicks on the Journal Ledger column for any row he/she will be directed to the journal ledger main tab page.
3.2.6 Profit And Loss Tab
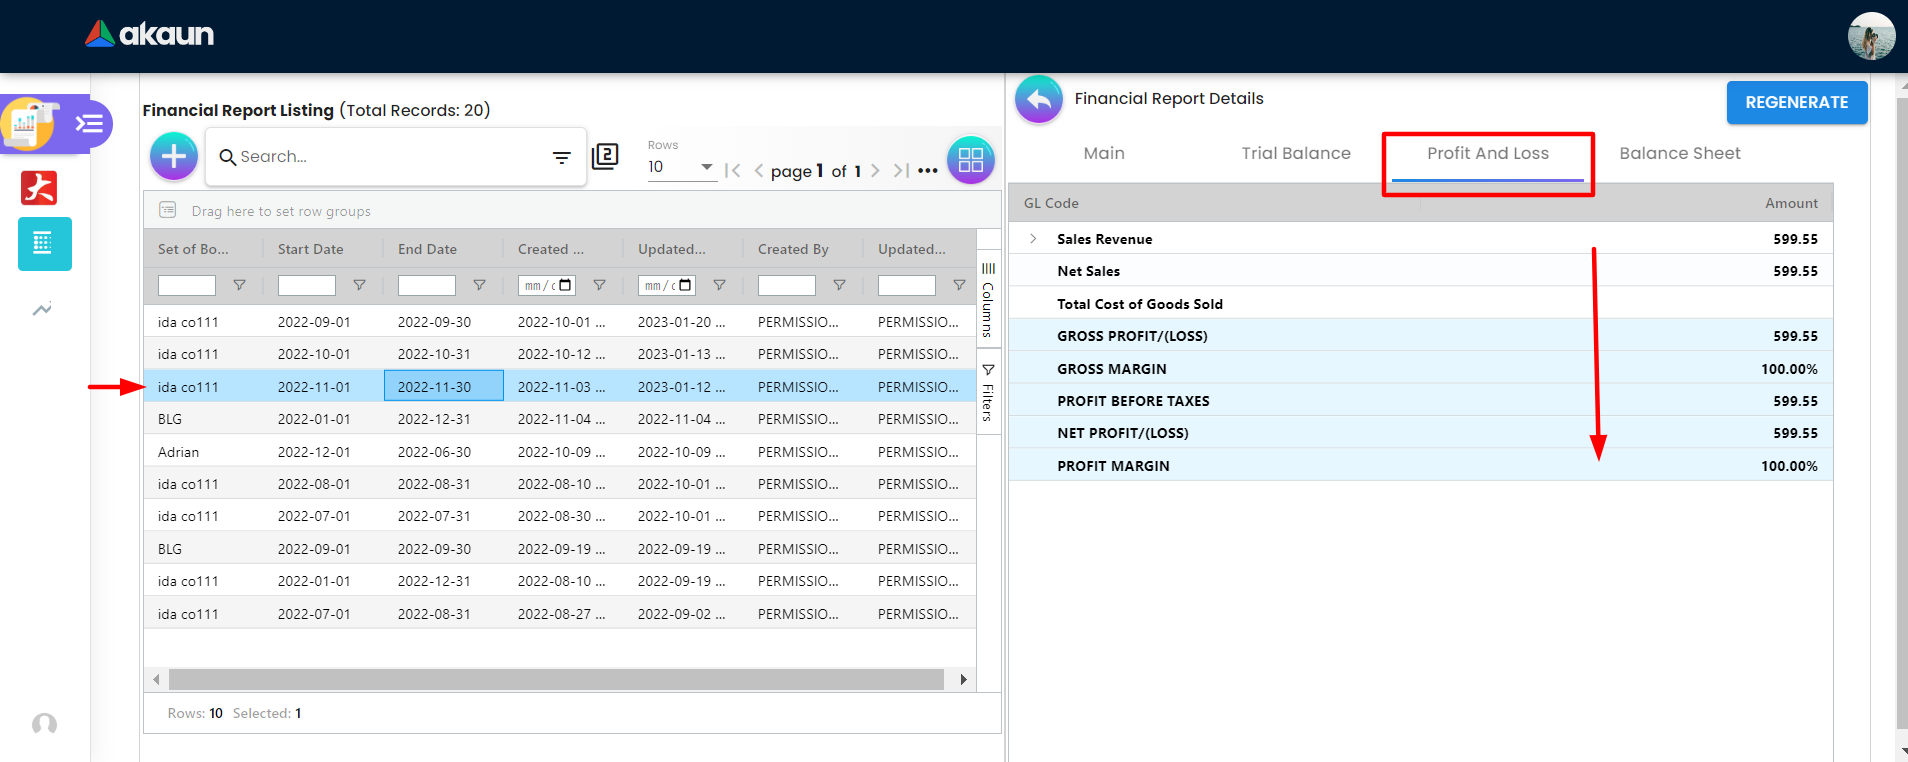
On profit and loss tab a table of two column GL Code and Amount. The Profit and Loss tab contain the following details:
-
Sales Revenue
-
Net Sales
-
Total Cost of Goods Sold
-
Gross Profit/(Loss)
-
Gross Margin
-
Profit Before Taxes
-
Net Profit/(Loss)
-
Profit Margin
There is a button on the top right corner to regenerate the data on the table. Each row of the Profit and Loss tab is clickable and when a user clicks on any row a new page will be popped up displaying details. This will be elaborated more in the sub-heading below.
3.2.6.1 Sales Revenue
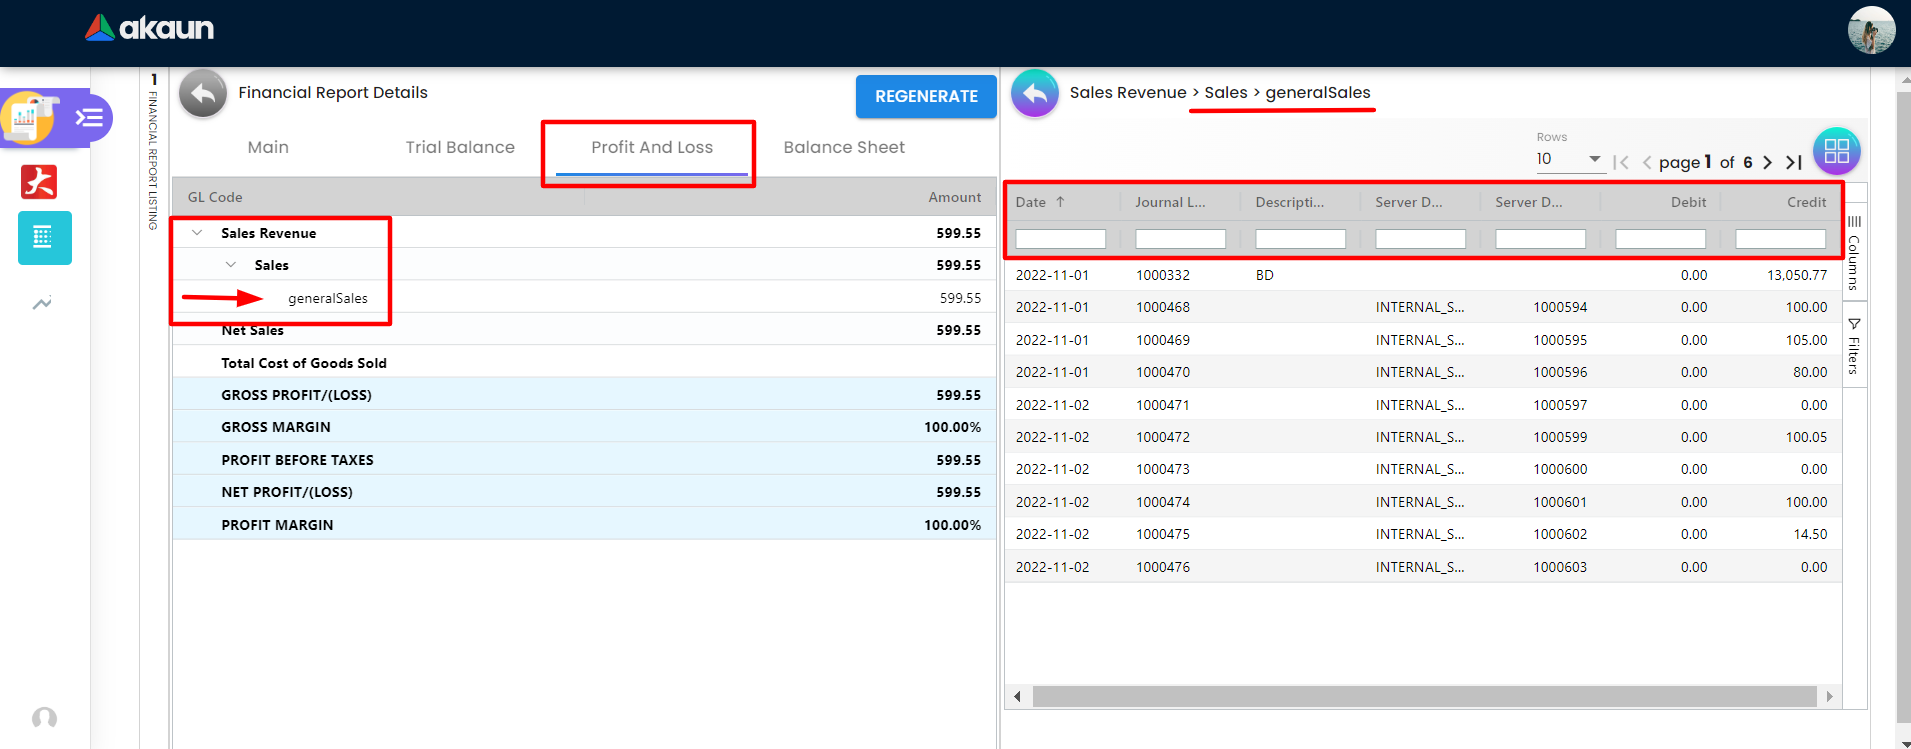
In sales revenue details about the profit and loss revenue will be shown. User need to navigate to Sales Revenue > Sales > generalSales to be able to view the sales revenue detail which are:
-
Date
-
Journal Ledger
-
Description
-
Server Doc Type
-
Server Doc No
-
Debit
-
Credit
3.2.6.2 Profit and Loss Details
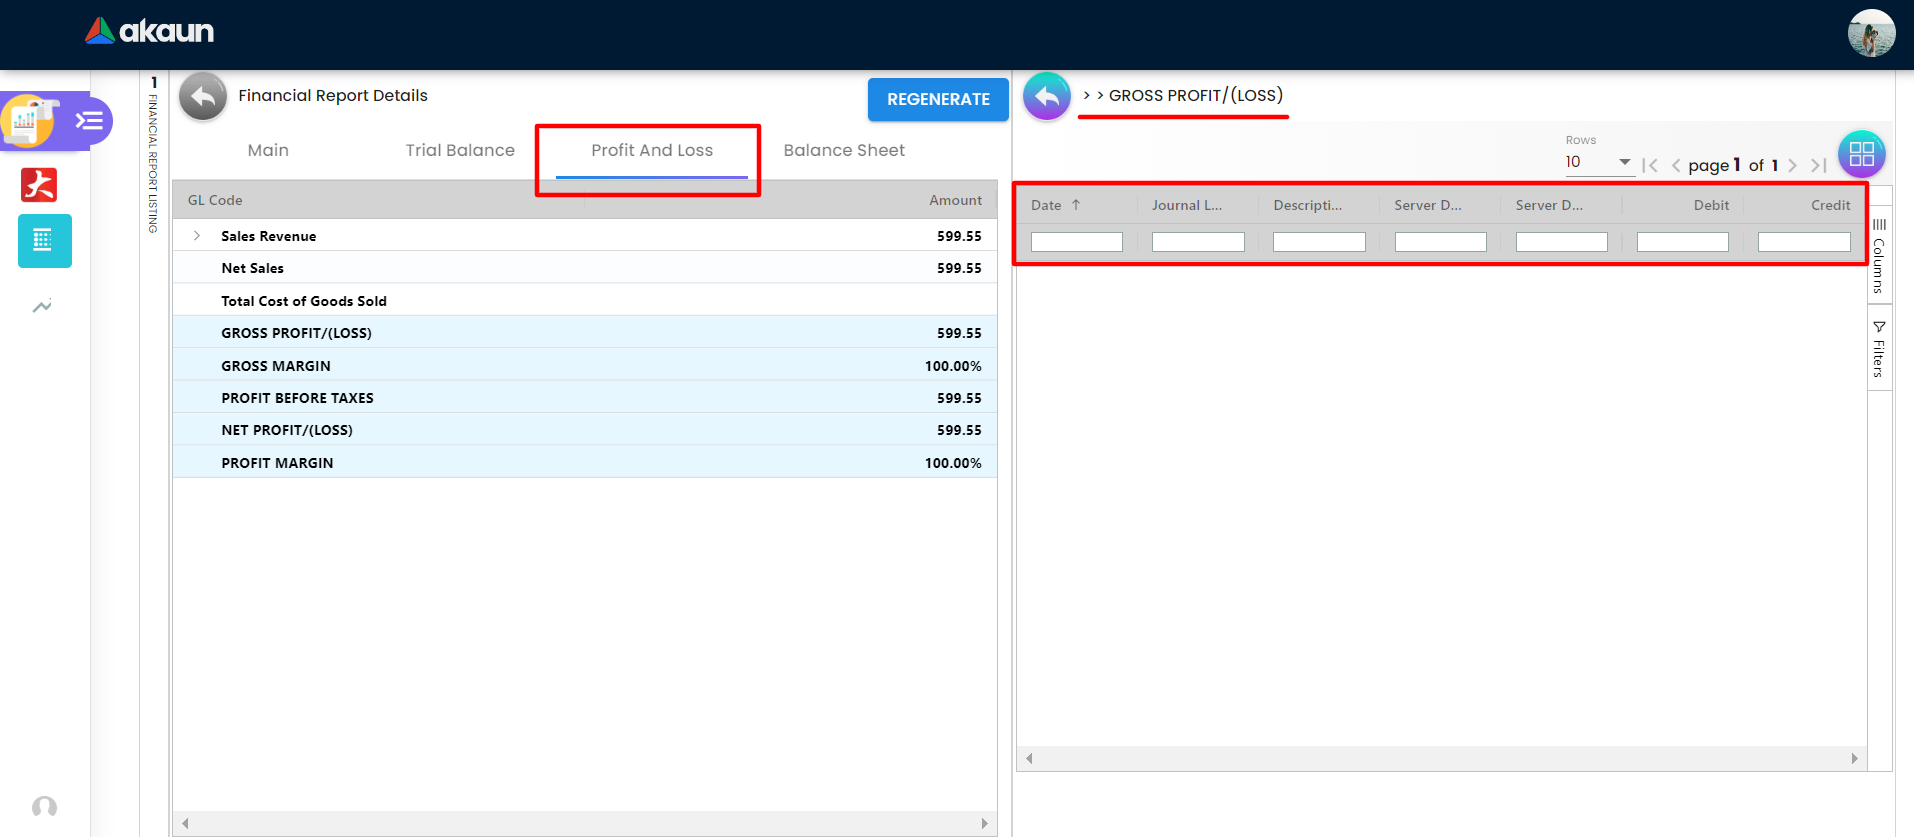
All remaining profit and loss table rows are showing the same columns but with their own data. The columns names are the same for the
-
Net Sales
-
Total Cost of Goods Sold
-
Gross Profit/(Loss)
-
Gross Margin
-
Profit Before Taxes
-
Net Profit/(Loss)
-
Profit Margin
Which displaying their own data under the columns names:
-
Date
-
Journal Ledger
-
Description
-
Server Doc Type
-
Server Doc No
-
Debit
-
Credit
Any row that has been clicked will be shown on the top of the financial report details page as shown on the above page with red underline.
3.2.7 Balance Sheet Tab
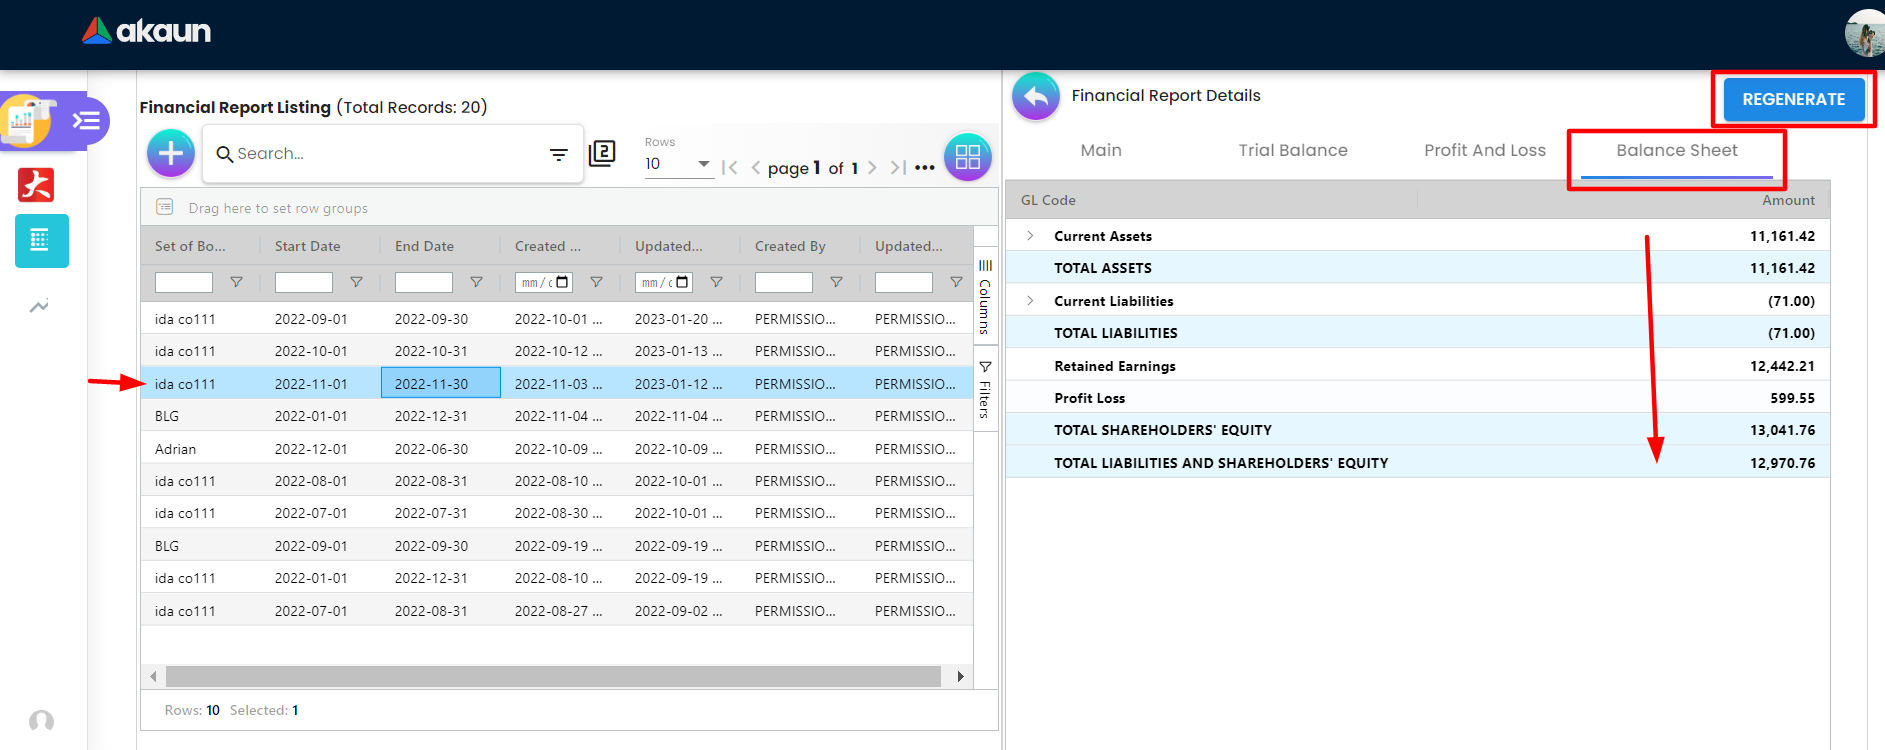
On the balance sheet tab a table of two column GL Code and Amount. The Profit and Loss tab contain the following details:
-
Current Assets
-
Total Assets
-
Current Liabilities
-
Total Liabilities
-
Retained earnings
-
Profit loss
-
Total Shareholders’ Equity
-
Total Liabilities And Total Shareholders’ Equity
There is a button on the top right corner to regenerate the data on the table. Each row of the balance sheet tab is clickable and when a user clicks on any row a new page will be popped up displaying details. This will be elaborated more in the sub-heading below.
3.2.7.1 Current Assets Cash
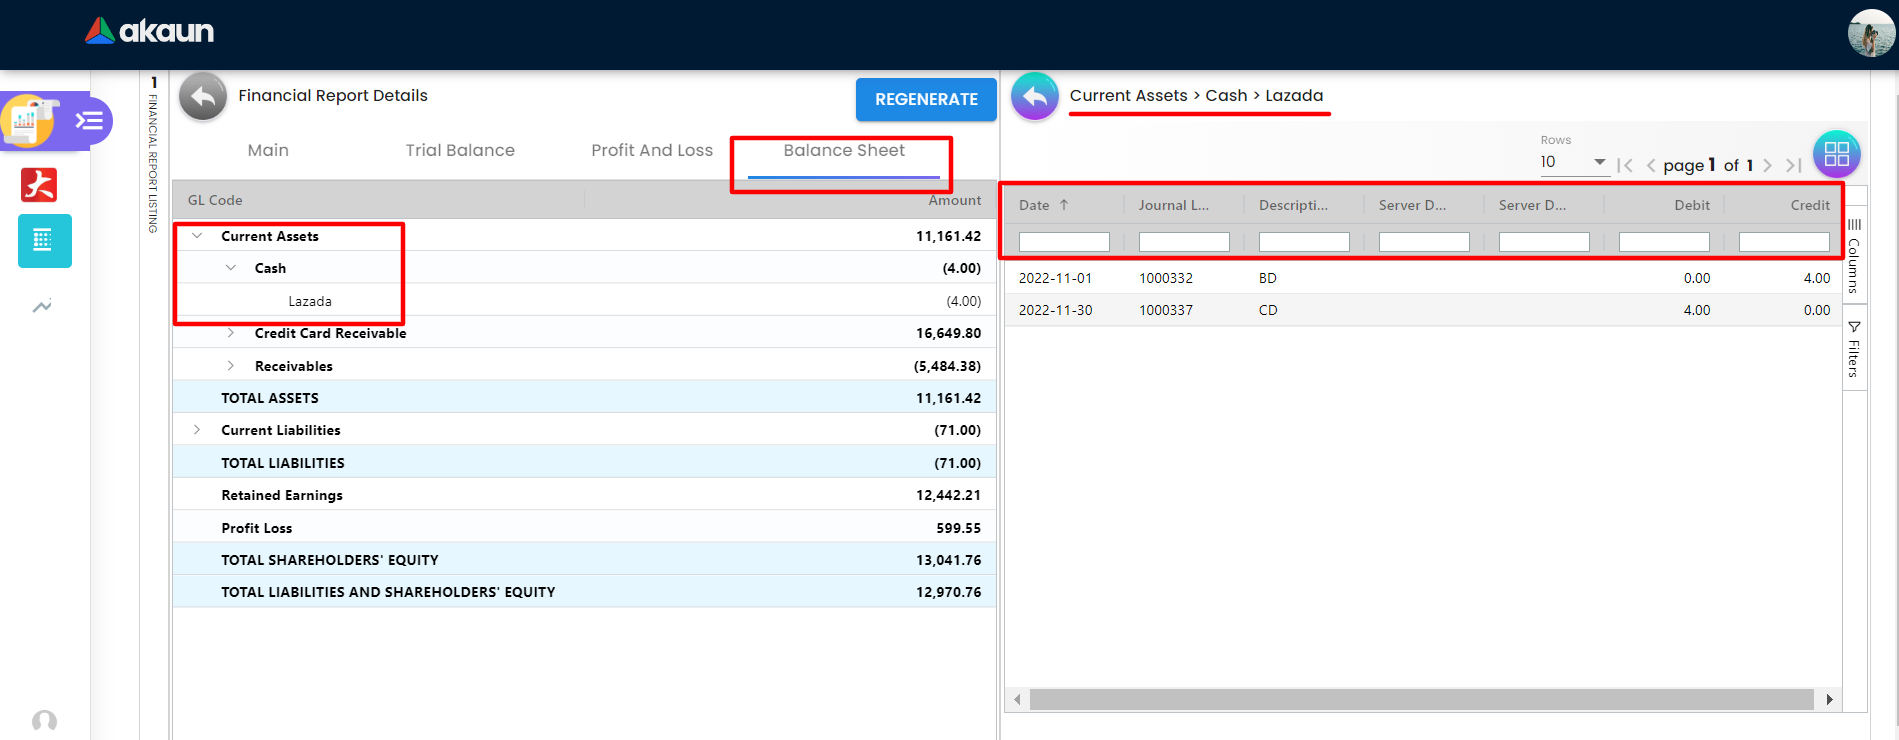
In Current Assets > Cash > Lazada, details about the balance sheet Lazada will be shown. User need to navigate to Current Assets - Cash - Lazada as shown in the above image to be able to view the Current Assets detail which are:
-
Date
-
Journal Ledger
-
Description
-
Server Doc Type
-
Server Doc No
-
Debit
-
Credit
Each row is clickable and it will direct you to Ledger and Journal Applet since these data are interrelated with Ledger and Journal Applet.
3.2.7.2 Current Assets Credit Card Receivable
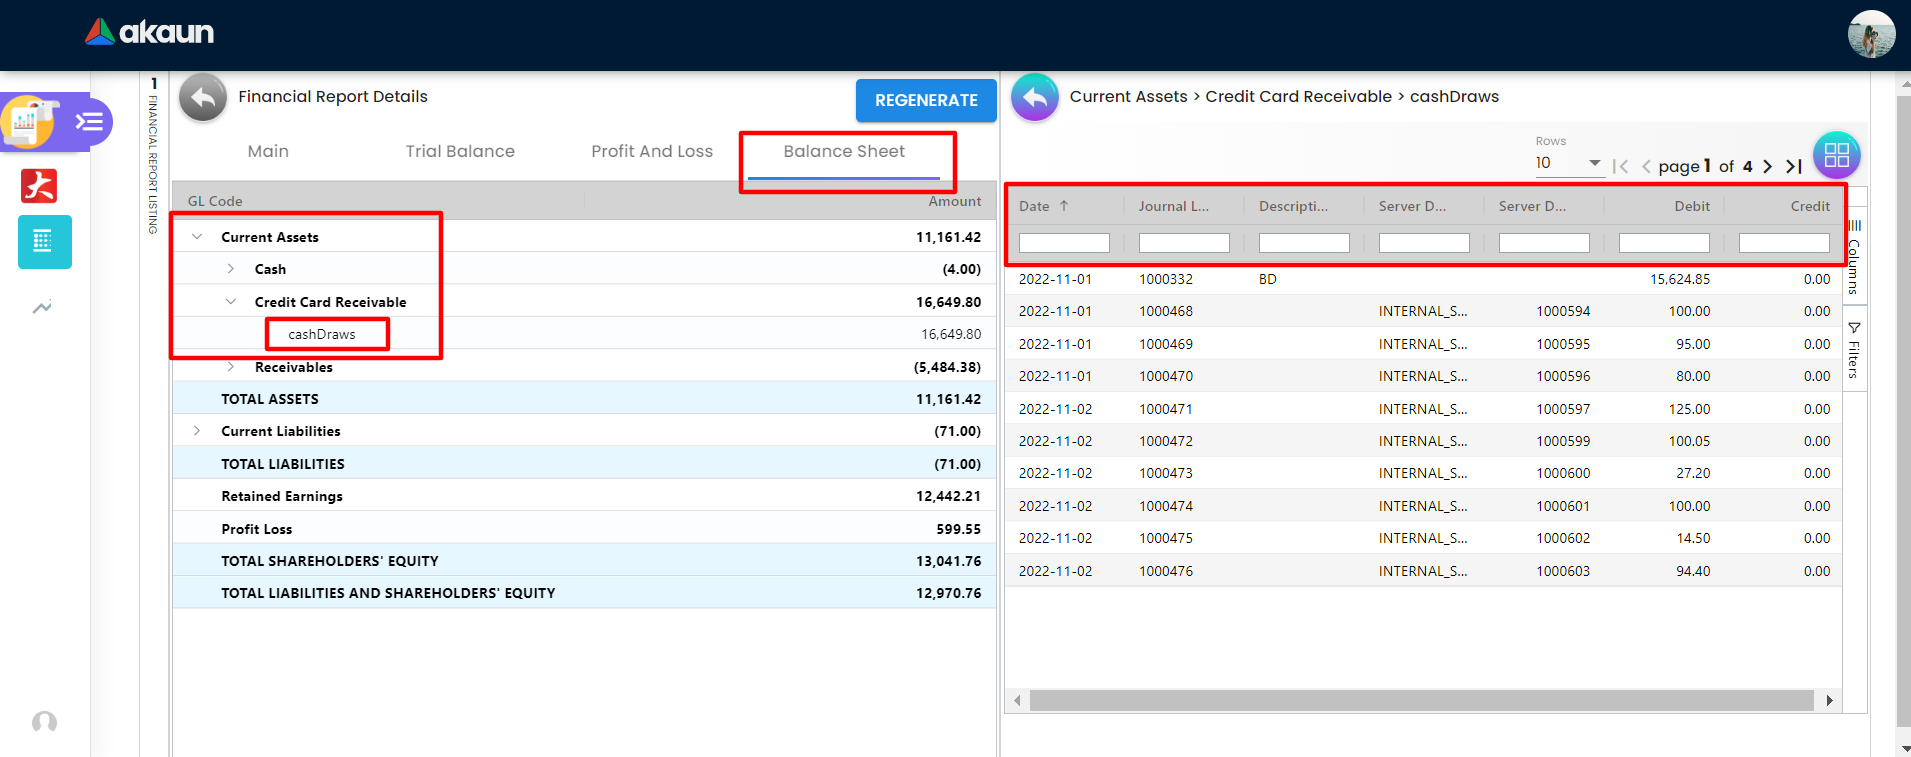
In Current Assets > Credit Card Receivable > CashDraws, details about the balance sheet CashDraws will be shown. User need to navigate to Current Assets > Credit Card Receivable > CashDraws as shown in the above image to be able to view the Current Assets detail which are:
-
Date
-
Journal Ledger
-
Description
-
Server Doc Type
-
Server Doc No
-
Debit
-
Credit
Each row is clickable and it will direct you to Ledger and Journal Applet since these data are interrelated with Ledger and Journal Applet.
3.2.7.3 Current Assets Receivable
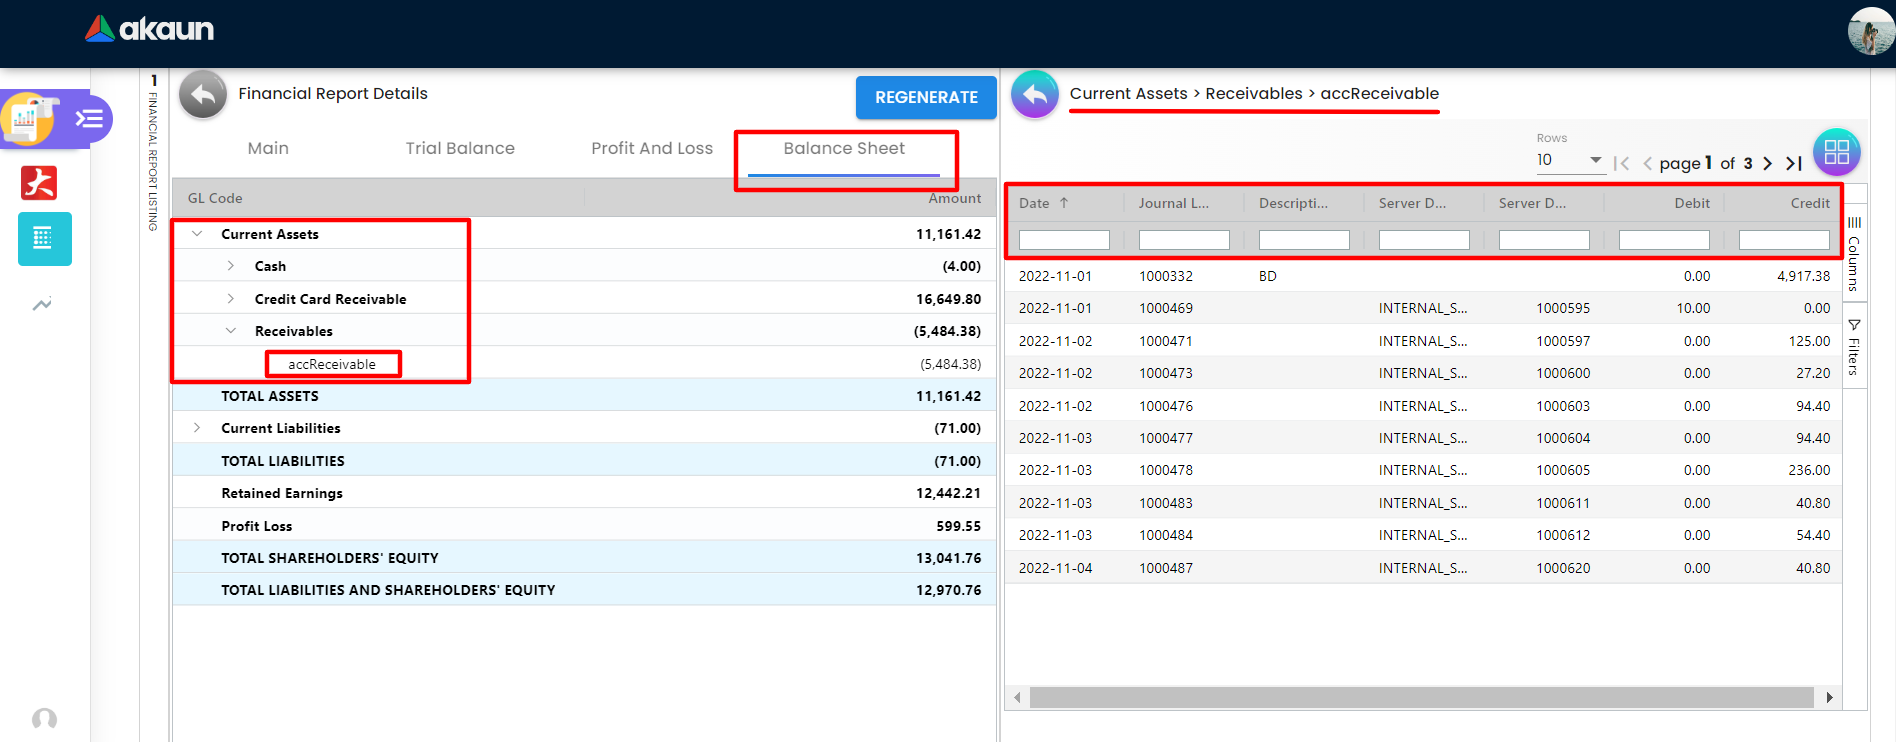
In Current Assets > Receivable > accReceivable, details about the balance sheet accReceivable will be shown. User need to navigate to Current Assets > Receivable > accReceivable as shown in the above image to be able to view the Current Assets detail which are:
-
Date
-
Journal Ledger
-
Description
-
Server Doc Type
-
Server Doc No
-
Debit
-
Credit
Each row is clickable and it will direct you to Ledger and Journal Applet since these data are interrelated with Ledger and Journal Applet.
3.2.7.4 Current Liabilities Account Payable
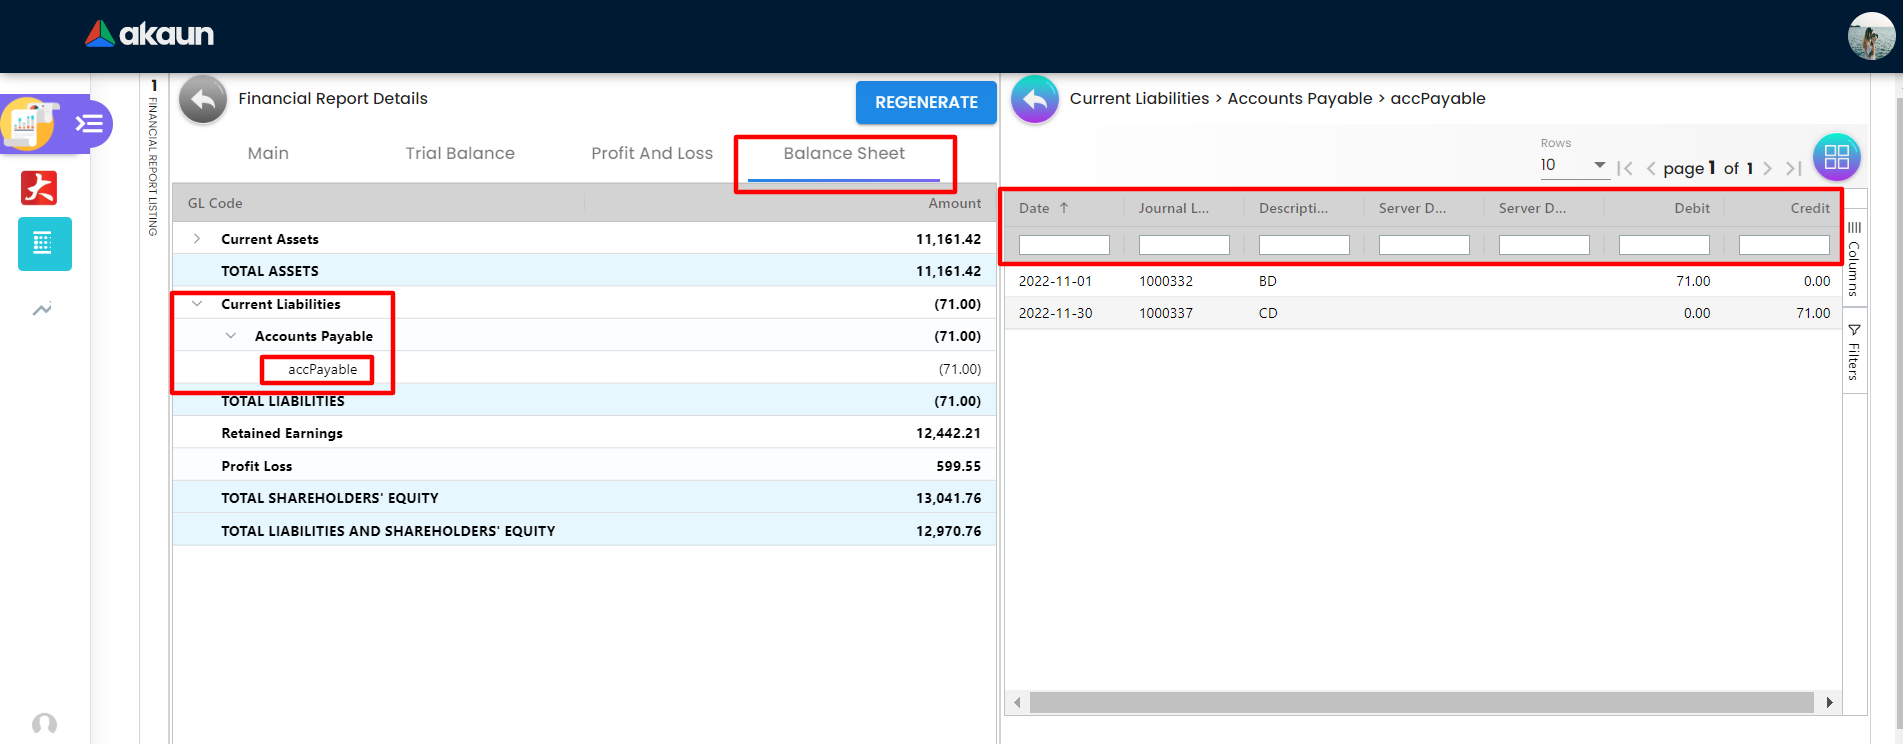
In Current Liabilities > Account Account > accPayable, details about the balance sheet accPayable will be shown. User need to navigate to Current Liabilities > Account Account > accPayable as shown in the above image to be able to view the Current Assets detail which are:
-
Date
-
Journal Ledger
-
Description
-
Server Doc Type
-
Server Doc No
-
Debit
-
Credit
Each row is clickable and it will direct you to Ledger and Journal Applet since these data are interrelated with Ledger and Journal Applet
3.2.7.5 Balance Sheet Details
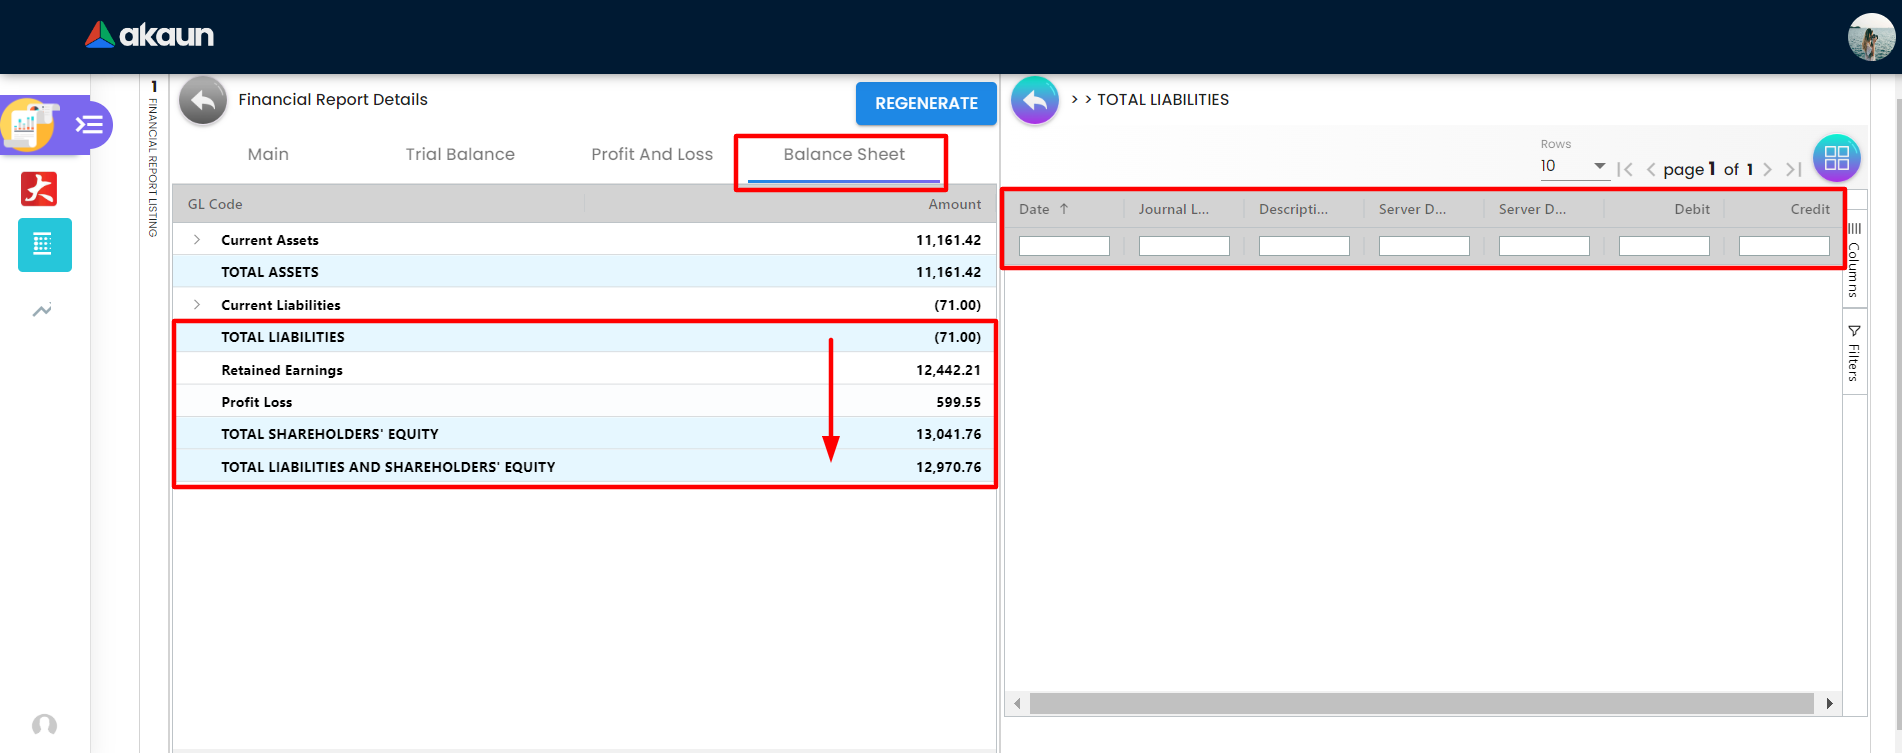
All remaining profit and loss table rows are showing the same columns but with their own data. The columns names are the same for the
Current Assets Total Assets Current Liabilities Total Liabilities Retained earnings Profit loss Total Shareholders’ Equity Total Liabilities And Total Shareholders’ Equity
Which displaying their own data under the columns names:
-
Date
-
Journal Ledger
-
Description
-
Server Doc Type
-
Server Doc No
-
Debit
-
Credit
Any row that has been clicked will be shown on the top of the financial report details page as shown on the above page with red underline.